Formation Flight for Commercial Aviation
Showing the potential with three case studies
Journal of Aircraft Paper
Follow on work from my PhD has recently been published in the Journal of Aircraft and is titled “Potential of Formation Flight for Commercial Aviation: Three Case Studies”.
The paper explores the concept of utilising the fuel-saving benefits of formation flight within a commercial flight setting.
I’d like to take the opportunity to have a quick summary overview of our approach and some of the exciting results.
Looking to nature for inspiration
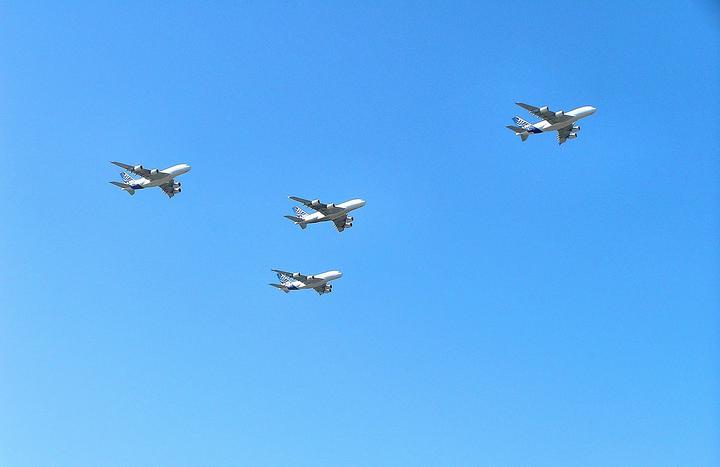
Scientist have long looked to nature for inspiration; the field of biomimicry is devoted to developing techniques to emulate nature’s strategies. For example geese, and other migratory birds, fly in a ‘V’ formation when travelling long distances. Research shows that birds participating in such formations will have significant increases to their range while exhibiting lower heart rates during flight compared to flying alone.

The aerodynamics
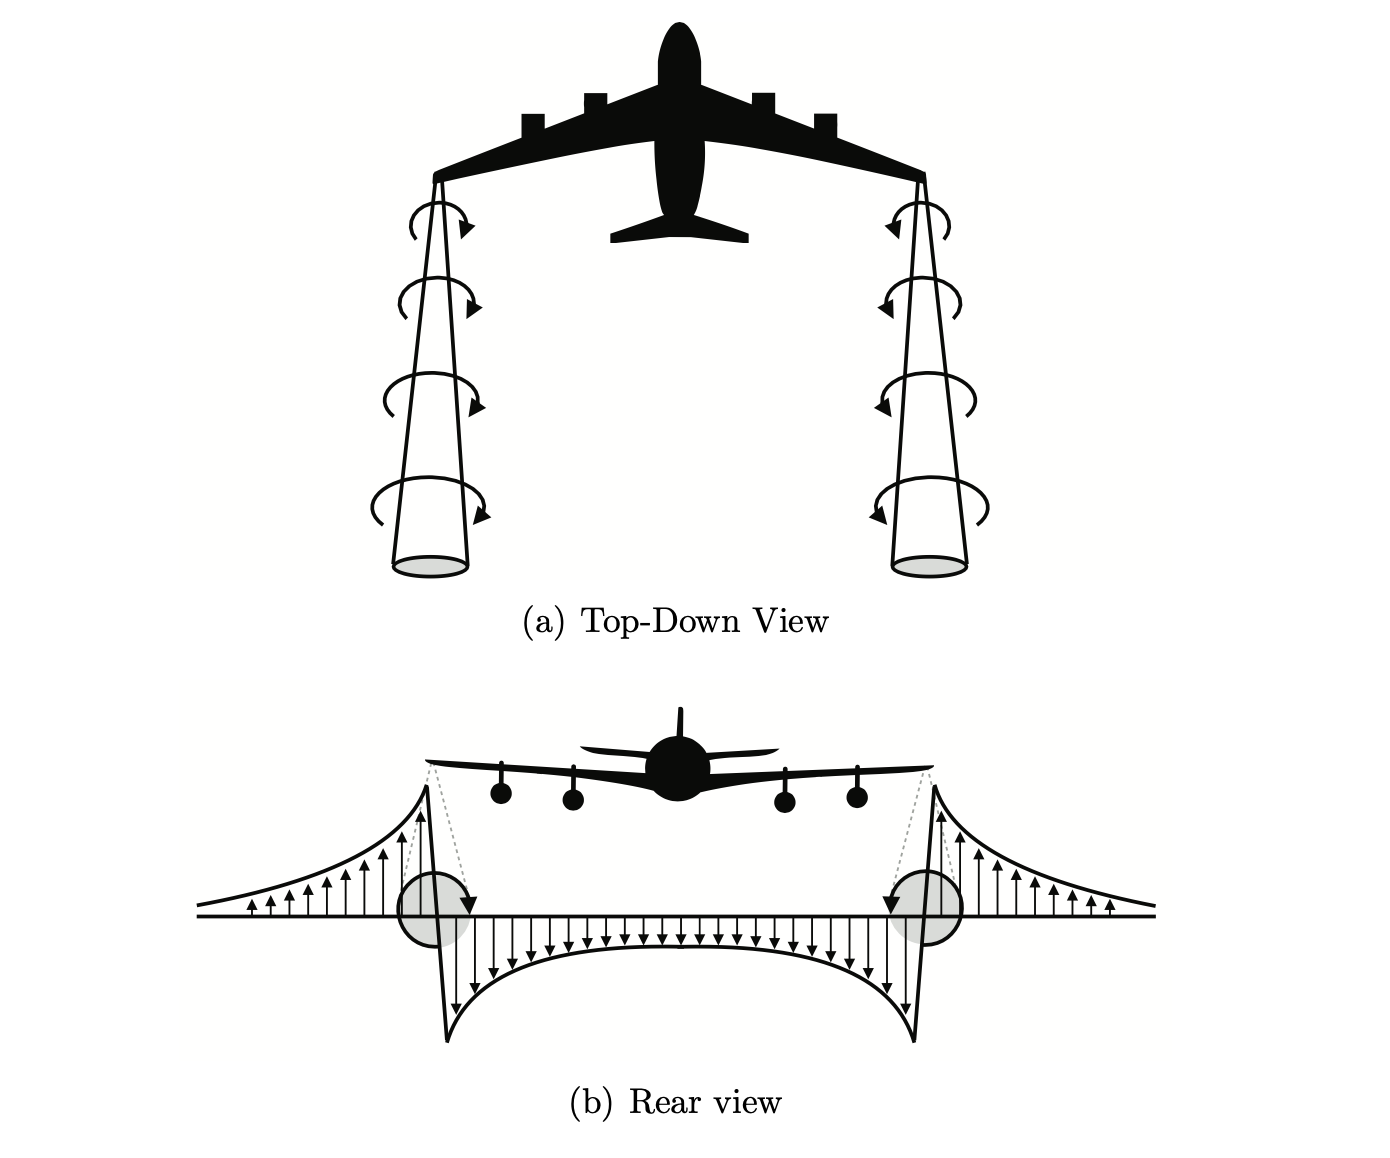
The aerodynamic fundamentals behind formation flight for aircraft are fairly well understood. As an aircraft flies, the pressure differentials created over the wings’ surface, generates lift. The wake (often called vortices) left behind the lifting-wing induces downwash inboard, between the aircraft wingtips, and a corresponding upwash outboard. In theory this means that if an aircraft flies through this region of upwash can get some ‘free lift’ (essentially operating at a lower angle of attack, reducing induced drag) and in turn save fuel.
Potential Savings
Ok, so theoretically how much could this fuel saving be?
While estimates regarding the exact levels of drag reduction are mixed, they all remain extremely promising. Some flight tests have recorded levels of induced-drag being reduced by as much as 40-60% for the trail aircraft in a formation of two, equating to roughly a 20-30% reduction in total drag. Alongside this, tests have also directly measured fuel-flow reductions, for an aircraft flying in the upwash of another aircraft, at levels of anywhere between 4-18%. Importantly for commercial formation flight, these kinds of savings can been observed flying as much as 10-40 wingspans behind the leading aircraft.
So in theory, what we call the proportional discount factor $\lambda$, could be in the range of 1-20%. However, fuel is only saved during formation and so many inefficiencies arise from aspects such as climbing and descending to appropriate flight levels, flying to rendezvous locations and even differing aircraft types. In an optimal situation formations would have identical departure and destination airports, spending their entire flight in formation. This is clearly not realistic and these inefficiencies naturally coincide with airlines needing to serve a large number of distinct airports at different times of the day.
Ok, how about realistically?
So this is what this paper looks to address, given the theory, how much fuel-saving could actually be achieved in realistic scenarios?
Focusing on two-aircraft formations, the paper builds upon theory outlined in a previous paper which uses a three stage approach:
- Enumeration: For all possible combinations, calculate the formation routes and corresponding costs.
- Preprocess: Eliminate combinations exceeding a schedule change constraint $\Delta t$.
- Assignment: Given the costs of all combinations remaining, assign a final fleet of formations to fly in order to minimize total cost.
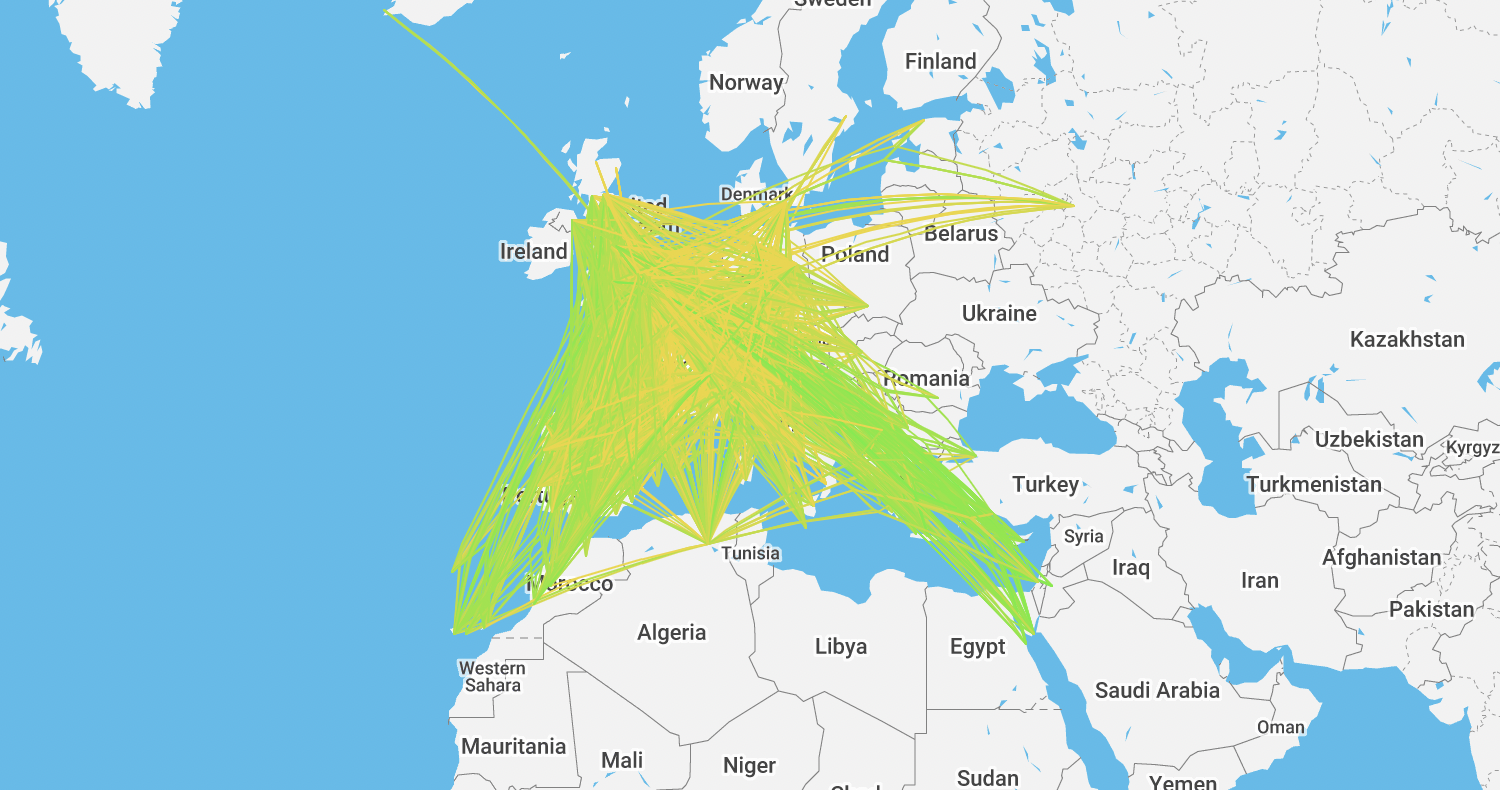
This approach is applied to three distinct use cases, with each being a representative, yet fictitious, airline:
- LHA: Long Haul Airline - Flights operating to serve a single regional airport (Singapore International Airport)
- TAA: Transatlantic Airline - Flights travelling from the United States to the UK and Mainland Europe
- LCA: Low Cost Airline - Short and Medium-haul flights operating across Europe.
There is a distinct spread of formation savings for each case study, with TAA showing savings ranging all the way up to the 9–9.5% interval, with over 70% of combinations producing fuel savings over 5%. Conversely, over 50% of the formations for the LCA would produce less than 1% fuel saving and, at most, 5%. The LHA flights lie somewhere in the middle, with results spread more evenly across all of 0–8.5%.
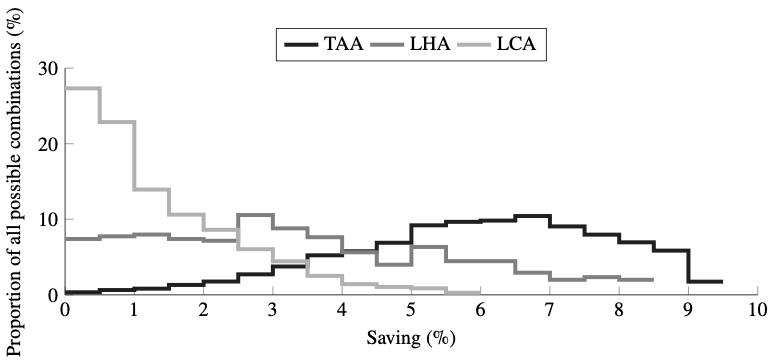
The overall average percentage fuel savings were promising for all the flight lists, with the transatlantic airline performing best at close to 9%, followed by the long-haul airline at just over 6%, whereas the low-cost airline flights produced a savings of just under 2%, showing that there is real potential even for the short-haul flights.
The paper looks at several key performance and suitability measures, for a range of proportional discount factors $\lambda$ between 1-20%, and a range of scheduling constraints.
The effect of scheduling constraints
Current airline schedules are complex and require careful planning. Aircraft looking to join in formation will have to alter their route and/or their schedule. For two flight to synchronize for optimal rendezvous/break locations, aircraft will need to either alter their speeds or their takeoff times (The impact of delay/speed changes can be found in our UKACC paper).
For a fixed formation discount factor, $\lambda$, of 10%, as we dial-up the number of minutes each formation’s schedule can be altered ($\Delta t$) we can observe the effect it has on formation savings.
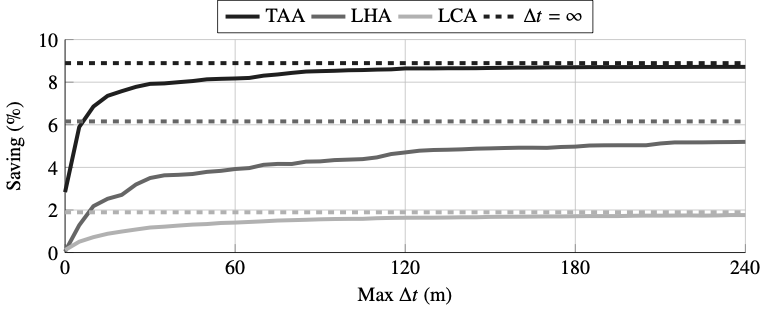
There are obviously very few suitable formations for a zero change in takeoff times; however, by simply allowing a $\Delta t$ of just 30 min, the assignments can achieve savings reasonably close to the unconstrained problem.
Fuel Saving and reduction in CO2
Our objective of minimizing fuel burn has the benefit that, by burning less fuel, airlines can proportionally spend less money on fuel; additionally, there is a proportional reduction in carbon dioxide (CO2) emissions that would have to be burned during solo flight. While fuel prices are constantly changing, a price of 600 U.S. dollars (USD) per metric tonnes (1000 kg) is the current rate as of February 2020. Additionally, the emissions index of CO2 per kilogram of fuel burned is estimated to be roughly 3.16. Using these rates, for scheduling restrictions of $\Delta t = 30$ and $\Delta t = 240$ we can see in the following Table the huge effect reducing fuel burn has on these factors. At the top end, the 210 transatlantic flights could save over 450,000 USD each day, with around 2500 tonnes less CO2 being emitted.
| Airline | $\Delta_t$ | No. Formations | Fuel saved (t) | Cost saved ($) | $CO_2$ saved (t) |
|---|---|---|---|---|---|
| LCA | 30 | 230 | 52 | 31,447 | 166 |
| LCA | 240 | 296 | 80 | 47,808 | 252 |
| LHA | 30 | 58 | 308 | 184,910 | 974 |
| LHA | 240 | 88 | 475 | 285,200 | 1,502 |
| TAA | 30 | 102 | 769 | 461,389 | 2,430 |
| TAA | 240 | 104 | 851 | 510,897 | 2,691 |
Suitability of Formation Flight
If a formation pair has a formation discount factor of 10%, this means that if both aircraft started and finished in formation, observing the fuel-burn saving over the entire flight, the maximum-achievable saving would be 10%. However, as aircraft obviously need time to climb and descend, and so cannot save fuel over the entire flight. The notion of the utilization, is the proportion of saving achieved to the maximum achievable. That is, the utilization factor measures how much of the potential fuel-saving is lost due to increases in deviation and cruise distance in order to reach rendezvous and separation points.
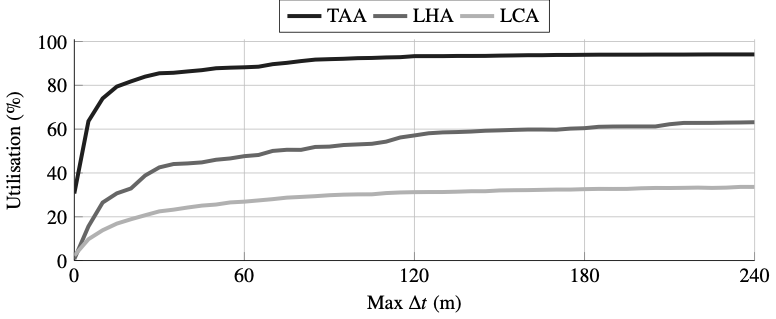
The values are plotted show a clear distinction between the three case studies. The TAA flights can achieve anywhere up to a very impressive 96% utilization; that is, out of the 9.3% theoretical-maximum savings achievable, roughly 8.9% was realized. The LCA and LHA flights, respectively, can achieve levels of utilization of up to roughly 35 and 75%. As the utilization factor is a result of a number of different components, such as geographical suitability and flight distance, but importantly dictated by the theoretical maximum. As aircraft are only considered to be in formations during the cruise leg of their flights, so a higher proportion of cruise to non-cruise flights equates to a greater theoretical-maximum saving. This adds to the fairly intuitive conclusion that longer flights in general are better suited to formation flight.
Sensitivity to Formation Discount
We now remove all scheduling constraints and look at the effect of changing the estimated formation discount factor between 1-20% and observe the effect this has on total saving.
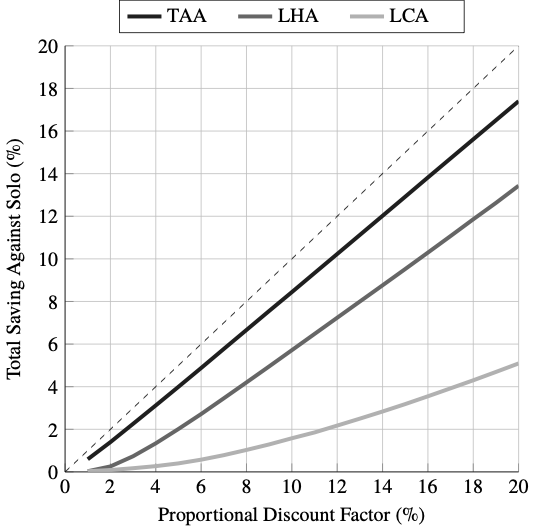
It is clear that formation flight shows real potential for a wide range of possible formation discount factors for all three case studies and what remains is how can this concept become a reality?
What next?
Excitingly this potential for reducing costs, emissions and fuel burn has not gone unnoticed with companies such as Airbus running real world flight tests.
Airbus Fello’fly
“The Airbus fello’fly demonstrator project is putting the principles of wake-energy retrieval to the test as a way to reduce CO2 emissions—by between 3 and 4 million tons per year on widebody operations. But flying two large passenger aircraft close together poses new operational challenges for the aviation ecosystem at large, requiring new procedures to be identified.”
This video by Airbus excellently describes how these concepts could be utilised in order to actually realise some of these fuel savings.
In fact they are already conducting flight tests:
“Initial flight tests have already begun. The fello’fly team and their flight test colleagues are testing pilot assistance technology—designed to ensure safety standards are optimal when flying two aircraft close together—in a programme that will lead the way to flight demonstrations in an oceanic airspace in 2021, involving airlines and ANSPs and a controlled Entry-Into-Service by 2025.”
Further reading
You can take a look at the paper:
You can also play around with some of the data here: http://tomekent.com/FormationFlight/
Thomas E. Kent
Lead Machine Learning Scientist
A Research Scientist at Mind Foundry. Previously a Senior Research Associate at the University of Bristol. I am interested in exploring how we can utilise AI, Machine Learning and Decision Making techniques to solve real world problems